Optimization Overview
To view the optimization overview, click on the "Optimization" tab, then select "Overview".
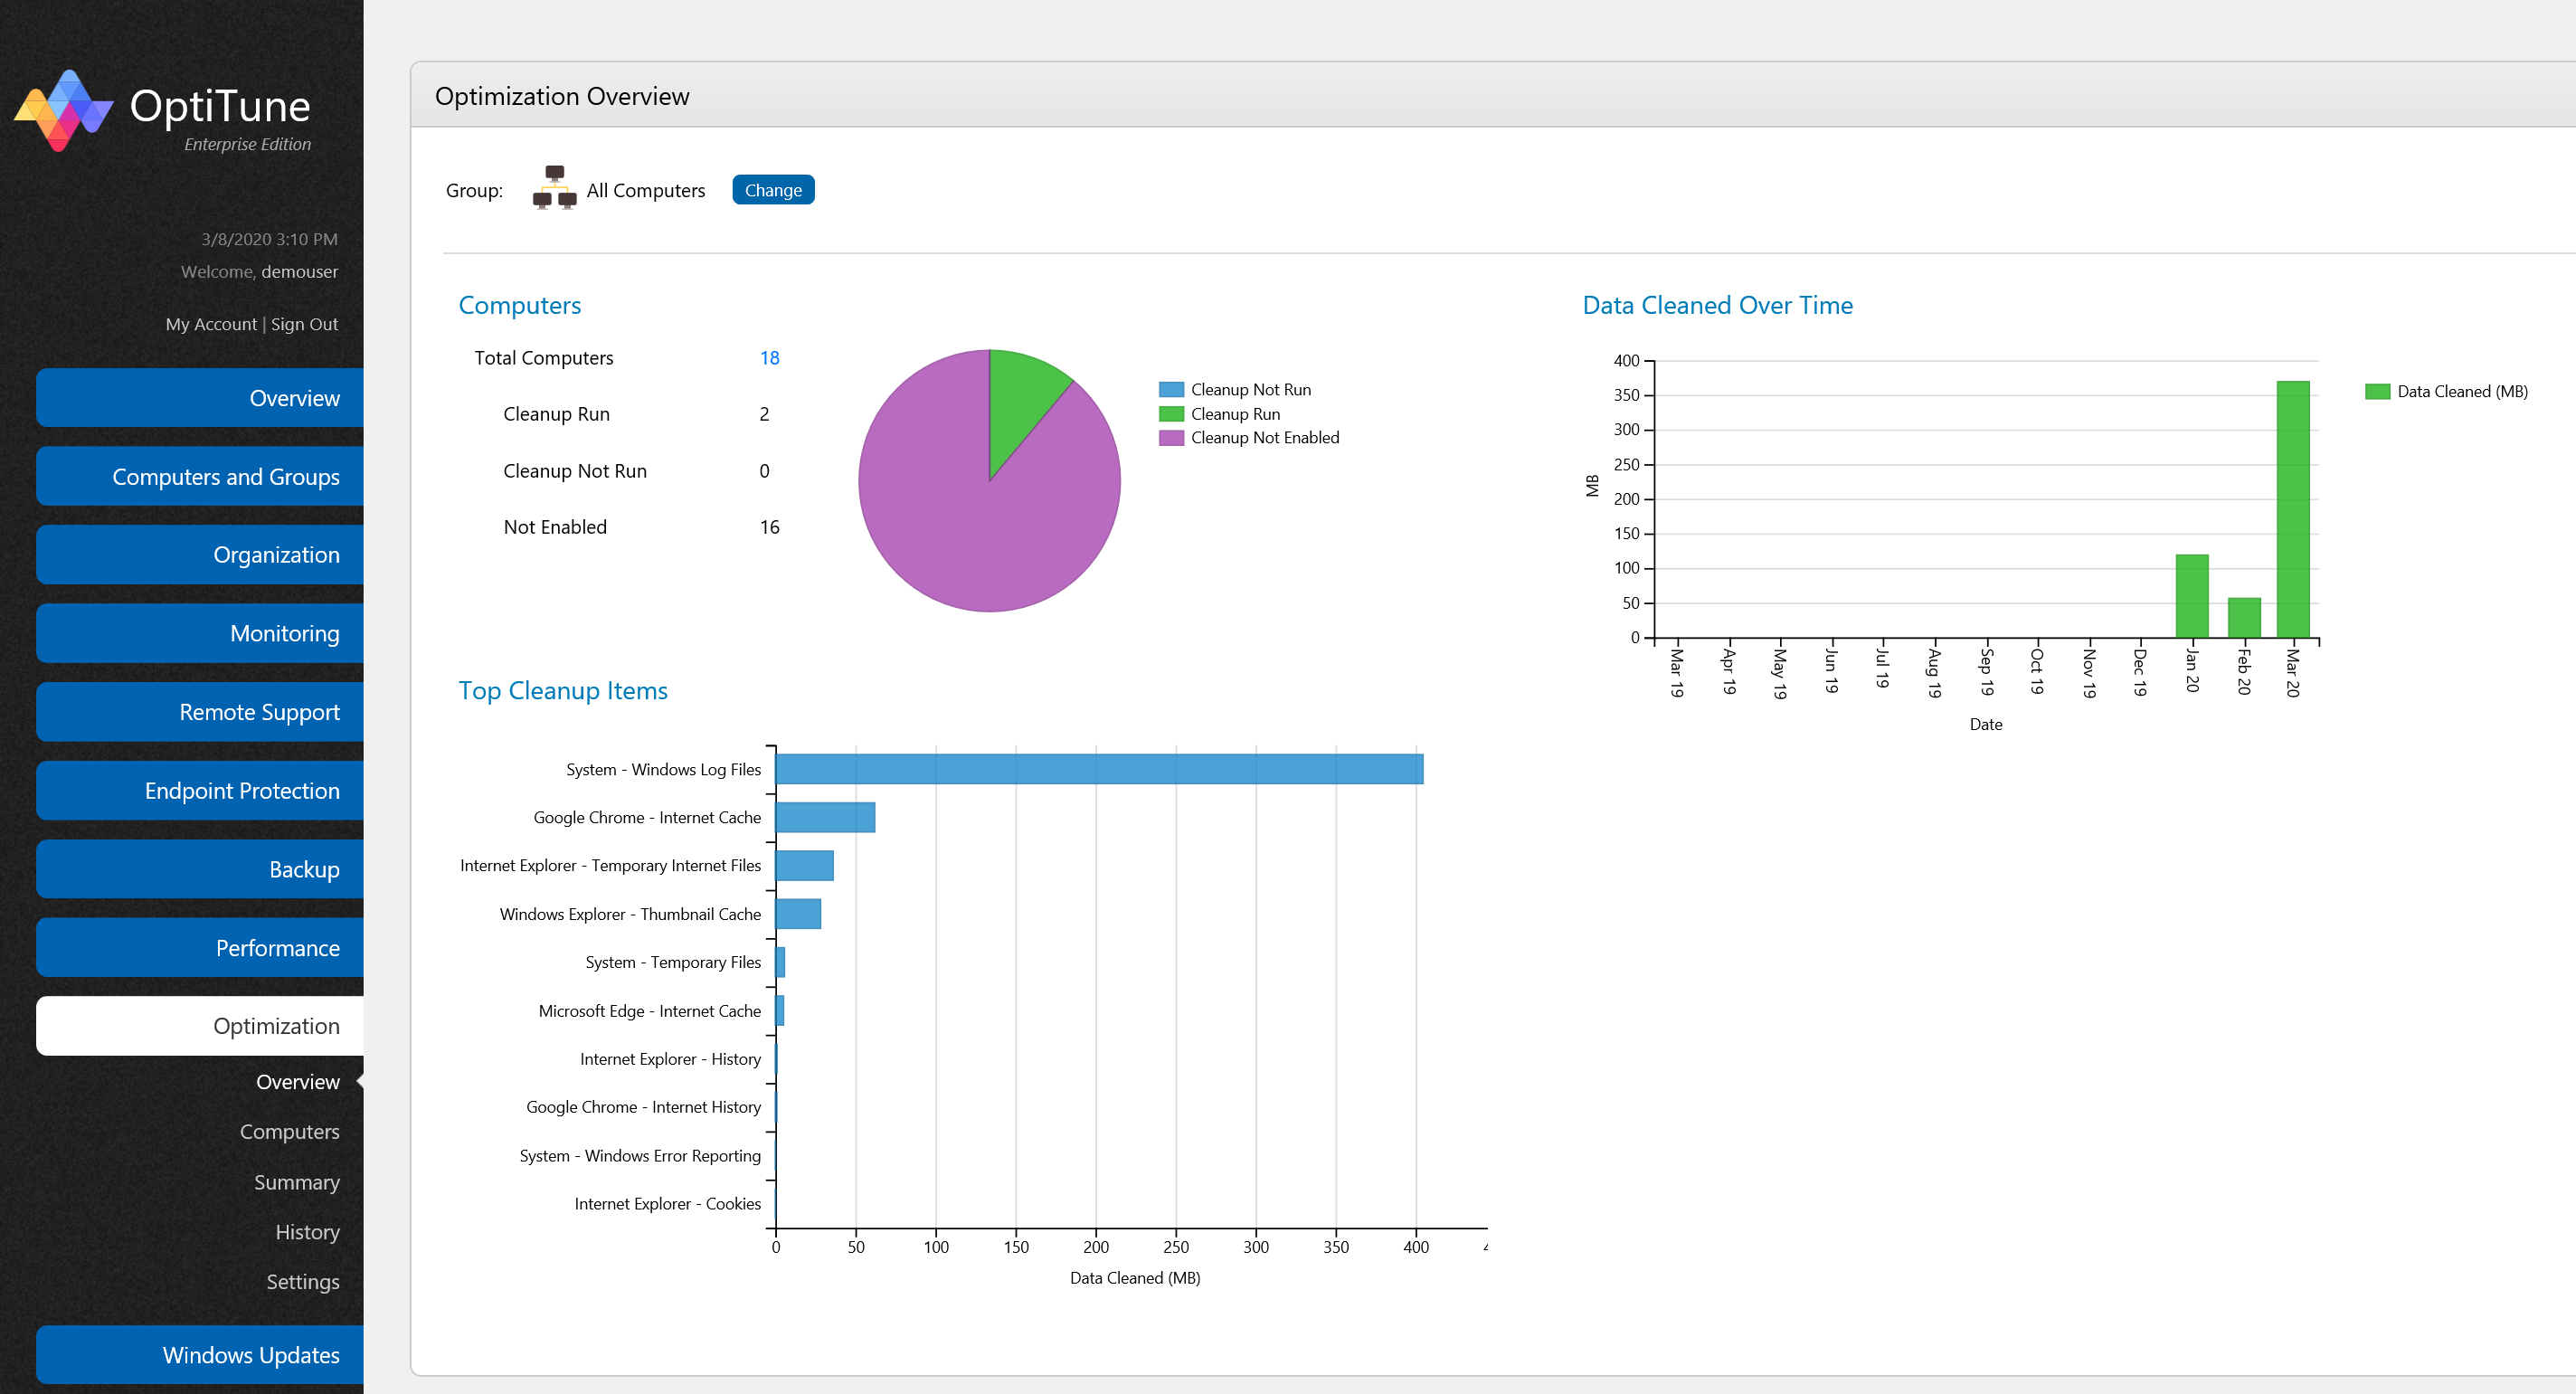
On this screen, you will find several charts showing high level status about optimization and cleanup activity. You can change the computer or group selected by clicking on the "Change" button at the top of the screen.
You can also click on any numbers in blue to view more details.
Computers
This chart shows a breakdown of computers according to their optimization state.
It shows the following categories of computers:
Cleanup Run - At least one cleanup has run on these computers
Cleanup Not Run - Optimization is enabled, but cleanup has not run on these computers
Not Enabled - Optimization is not enabled on these computers
Top Cleanup Items
This chart shows the top cleanup items, by bytes cleaned/deleted, across all computers in the given group, for the entire available cleanup history.
Data Cleaned Over Time
This chart shows the cleanup history by month, for the group of computers (or single computer) selected.
The areas in green represent the total bytes cleaned for each month.